You open your website analytics. There are numbers everywhere: visitors, page views, traffic sources, clicks, conversions, search queries, popular pages, devices, engagement. Maybe even charts going up and charts going down.
You look at everything. Then you close the dashboard. And nothing changes.
Sound familiar?
Analytics aren't valuable simply because you have them. They're valuable when they help you ask better questions, identify opportunities, make better decisions, improve the customer experience, and take meaningful action.
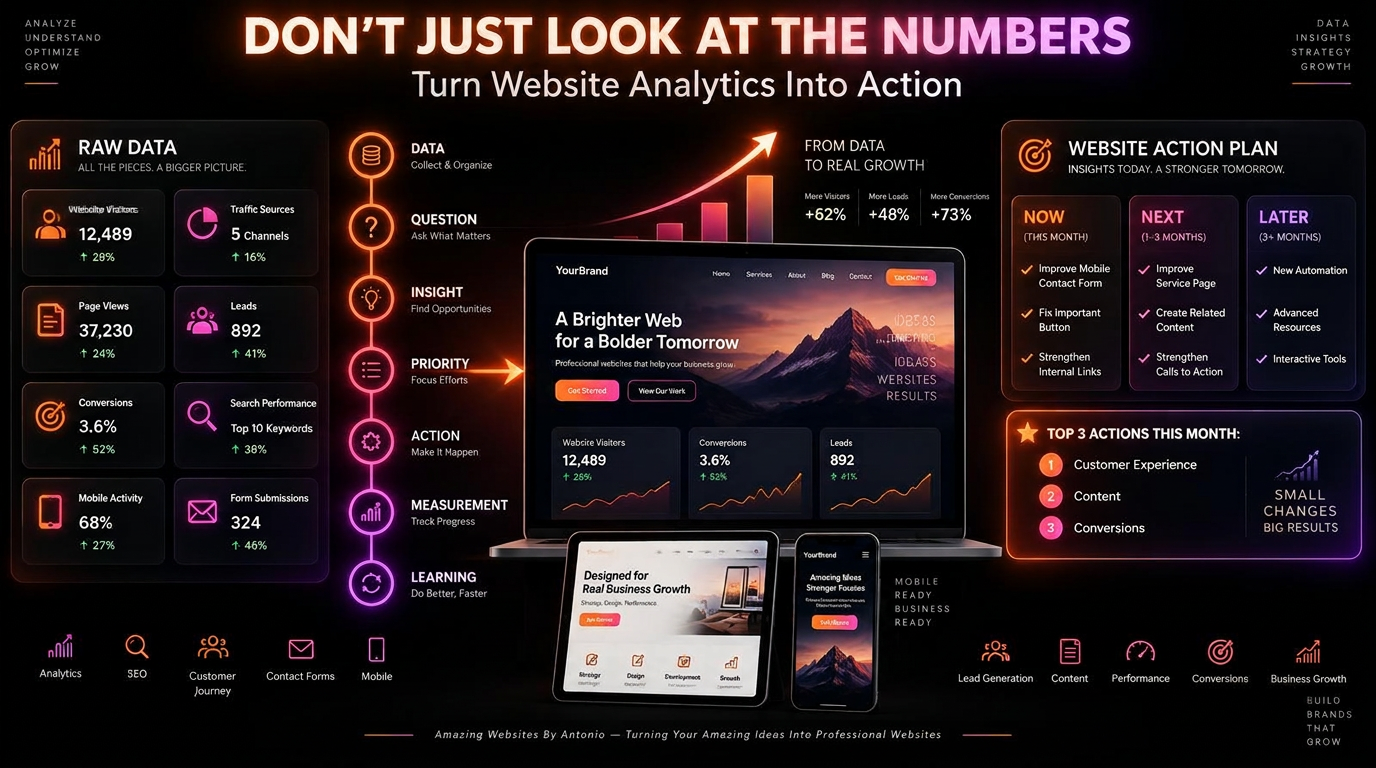
The goal isn't data, dashboard, done. The goal is a cycle: data, question, insight, priority, action, measurement, learning.
Let's turn website analytics into an action plan.
1. Start With Your Website Goal
Before looking at the dashboard, remind yourself: what is this website supposed to accomplish?
- For a service business, the goal might be generating qualified project inquiries.
- For an online store: generating product sales.
- For a nonprofit: generating donations, volunteers, or event registrations.
- For a content platform: growing readership or subscriptions.
Your goal determines which analytics deserve your attention.
2. Don't Start With Every Number
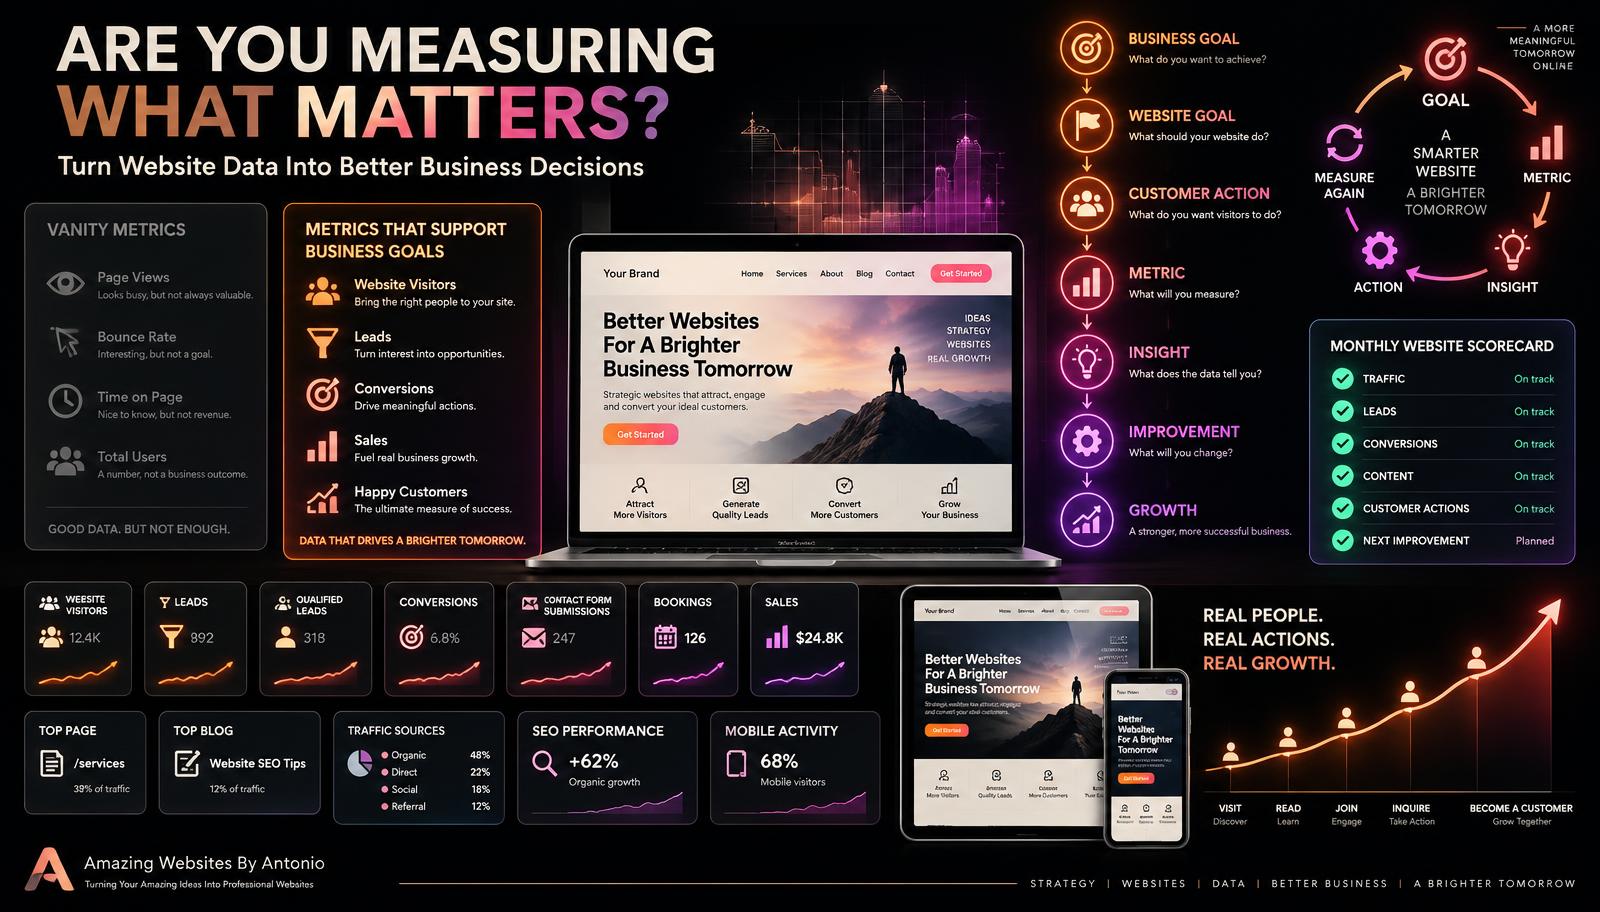
Analytics platforms can show more information than you need. Instead of reviewing everything, begin with the metrics connected to your goals. For example: website visitors, traffic sources, important pages, leads, qualified leads, form submissions, bookings, purchases, conversions, and search performance. Keep the first review focused.
3. Establish a Baseline
Before deciding whether something improved, understand where it started. For example, a month-one baseline might be: 1,000 visitors, 20 contact inquiries, 10 qualified leads, 5 bookings, and 30 newsletter signups.
Then compare future results with the baseline. A number without context is difficult to evaluate.
4. Look for Patterns
One unusual day may not mean much. Instead, look for patterns. For example:
- Traffic has increased for three months.
- Mobile visitors consistently leave an important page before completing an action.
- A specific blog repeatedly attracts relevant search traffic.
- One service page regularly leads visitors to Contact.
Patterns can reveal where to investigate.
5. Look for Changes
Ask: what increased? What decreased? What stayed consistent? What changed unexpectedly?
Changes can create useful questions. For example, contact-page traffic increased 40%, but inquiries stayed the same. That doesn't immediately tell you the problem — it tells you where to investigate.
6. Don't Jump From Data Directly to a Conclusion
Suppose visitors spend less time on a page. You might think the page isn't engaging enough. Maybe. Or maybe visitors found what they needed faster.
Analytics often tell you what happened. They don't always tell you why. Treat data as evidence — not automatic explanation.
7. Turn Observations Into Questions
Instead of saying our Contact page isn't working, ask why more visitors are reaching Contact without submitting the form.
Instead of saying a blog is successful, ask why it attracts more relevant visitors than other articles.
Instead of saying mobile visitors don't like the website, ask whether something is making the page harder to use on mobile.
Questions lead to investigation.
8. Prioritize Questions That Support Business Goals
You may identify 20 interesting patterns. You don't need to investigate all 20 immediately. Focus on questions connected to customer experience, leads, sales, bookings, important services, accessibility, website functionality, and business priorities.
Interesting isn't always important.
9. Review the Customer Journey
Analytics become more useful when you think in journeys instead of isolated pages. For example: homepage, then services, then portfolio, then testimonials, then contact, then form submission.
Ask: where do visitors continue? Where do they stop? Where do they go somewhere unexpected? Where do they complete the intended action?
10. Identify Important Entry Pages
Not every visitor starts on your homepage. Someone may enter through a blog, a service page, a portfolio project, a search result, or a shared link.
Review popular entry pages and ask: if someone entered here without seeing the homepage, would they understand who we are, what we offer, and what to do next?
11. Review Exit Points Carefully
A visitor leaving isn't automatically bad. If someone finds your phone number and leaves to call you, that may be successful. If someone reads a helpful article and gets the answer they needed, that may also be successful.
Evaluate exits in context.
12. Review Traffic Sources
Ask which channels bring visitors: search, social media, email, referrals, advertising, or direct visits.
Then go further: which sources bring visitors who complete meaningful actions?
13. Connect Traffic to Outcomes
Don't stop at a social network sending 300 visitors. Ask: how many explored Services? How many viewed Portfolio? How many submitted an inquiry? How many became qualified leads?
Traffic becomes more useful when connected to outcomes.
14. Identify Your High-Value Content
A high-value page isn't necessarily your most-viewed page. Maybe one service page receives only 100 visits but generates several strong inquiries. That may be more valuable than a page receiving thousands of unrelated views.
Define value according to business goals.
15. Identify Content Opportunities
Suppose a blog about website accessibility attracts relevant search traffic. A possible action is creating related content: an accessibility checklist, an accessible forms article, a color contrast guide, a mobile accessibility article, or an accessibility FAQ.
Successful topics can become content clusters.
16. Find Internal-Linking Opportunities
If a blog attracts visitors but few continue deeper into the website, ask: does it link to a relevant service, another useful article, a case study, the FAQ, or Contact?
Help visitors discover the next useful step.
17. Review Call-to-Action Performance
If your tools allow appropriate click tracking, review important calls to action, such as Start Your Project, View Services, Book Now, Get a Quote, or Download Guide.
If visitors aren't using an important button, investigate. Maybe the wording is unclear, the button is hard to notice, the offer isn't compelling, or the button appears at the wrong point in the journey.
18. Review Form Performance
If visitors reach a form but don't submit it, examine the experience. Ask: is the form too long? Are we asking for unnecessary information? Are instructions clear? Does it work well on mobile? Are there technical errors? Does the visitor know what happens next?
19. Review Mobile Data
If a large part of your audience visits from mobile devices, make sure the mobile experience supports important actions. Look for difficult navigation, small buttons, long forms, layout issues, slow loading, and hard-to-read text.
Then test the website yourself on real devices.
20. Review Website Performance
If an important page is slow, investigate: large images, heavy video, third-party tools, animations, or scripts.
Don't assume speed is the issue solely from behavioral analytics. Use appropriate performance testing too.
21. Review Search Data
Search-performance information may reveal the questions people search, the pages appearing in results, topics gaining impressions, pages receiving clicks, and content opportunities.
Use search data to understand audience interest.
22. Find Almost-There Opportunities
Sometimes a page is already getting attention but could become more useful. For example, a blog receives search impressions and some clicks. It might benefit from updated information, a clearer title, more useful examples, better internal links, improved formatting, or a stronger next step.
Improving something already showing potential can be valuable.
23. Compare Similar Pages
Suppose you have three service pages: one generates many inquiries, one receives traffic but few inquiries, and one receives little traffic. Compare them. What is different? Messaging? Proof? Calls to action? Traffic source? Search visibility? Audience intent?
The comparison may reveal opportunities.
24. Combine Analytics With Customer Feedback
Data becomes more powerful when combined with real feedback. Analytics might show people leaving the pricing page. Customers might tell you they didn't understand what was included.
Now you have stronger evidence about what may need improvement.
25. Combine Analytics With User Testing
Watch someone try to complete an important task, such as finding the website-design service and contacting the business. Observe where they struggle.
This can reveal problems numbers alone cannot explain.
26. Create an Insights List
After reviewing your data, don't immediately change the website. Write down your findings. For example:
- Blog traffic is increasing.
- Mobile contact-form completion appears lower than expected.
- Portfolio visitors frequently continue to Contact.
- One service page receives very little traffic.
- Accessibility articles are attracting search visibility.
Now turn insights into questions.
27. Turn Insights Into Action Ideas
Insight: accessibility blogs attract search traffic. Action ideas: create more accessibility content, link articles together, and connect articles to relevant services.
Insight: mobile form completion is low. Action ideas: test the form on multiple phones, review the field count, check technical functionality, and review button visibility.
Notice: the insight doesn't dictate one answer. It creates informed possibilities.
28. Create an Analytics Action Plan
Use a simple format:
- Observation: what happened?
- Question: what might we need to understand?
- Evidence: what information supports the observation?
- Action: what will we change or test?
- Goal: what should improve?
- Measurement: how will we know what happened afterward?
This turns analytics into strategy.
29. Prioritize by Impact
You may have ten possible actions. Which ones matter most? Consider customer impact, business impact, the number of visitors affected, the severity of the problem, revenue or lead potential, accessibility, and the effort required.
Use the same thinking from your website improvement roadmap.
30. Put Actions Into Now, Next, and Later
Now: test the mobile contact form, fix the broken service-page button, and add internal links to a high-traffic blog.
Next: improve an underperforming service page, create an accessibility content cluster, and improve portfolio calls to action.
Later: create an advanced resource center, add new automation, and develop an interactive tool.
Analytics shouldn't create chaos. It should help improve prioritization.
31. Test Focused Changes
If possible, avoid changing everything at once. Suppose you're improving the Contact page. You might first shorten the form, then observe.
If you simultaneously change the headline, the form, the page layout, the call to action, the navigation, and the service prices, it becomes harder to understand what affected the outcome.
32. Document What You Changed
Create a simple change log. For example: on a given date, the contact form changed from 12 fields to 6. Reason: mobile visitors appeared to struggle with form completion. Goal: make inquiries easier.
Now future data has context.
33. Define Success Before Making the Change
Before implementing something, ask what result you're hoping for. For example: change — improve internal links on a popular blog. Goal — help more readers discover related services and content. Measurement — relevant internal-link activity and downstream actions.
Define the question before reviewing the answer.
34. Give Changes Enough Time
Don't make a change Monday morning and declare it unsuccessful Tuesday afternoon. You may need enough traffic, time, conversions, and customer feedback to evaluate the change meaningfully.
How much is enough depends on the website and decision.
35. Measure Again
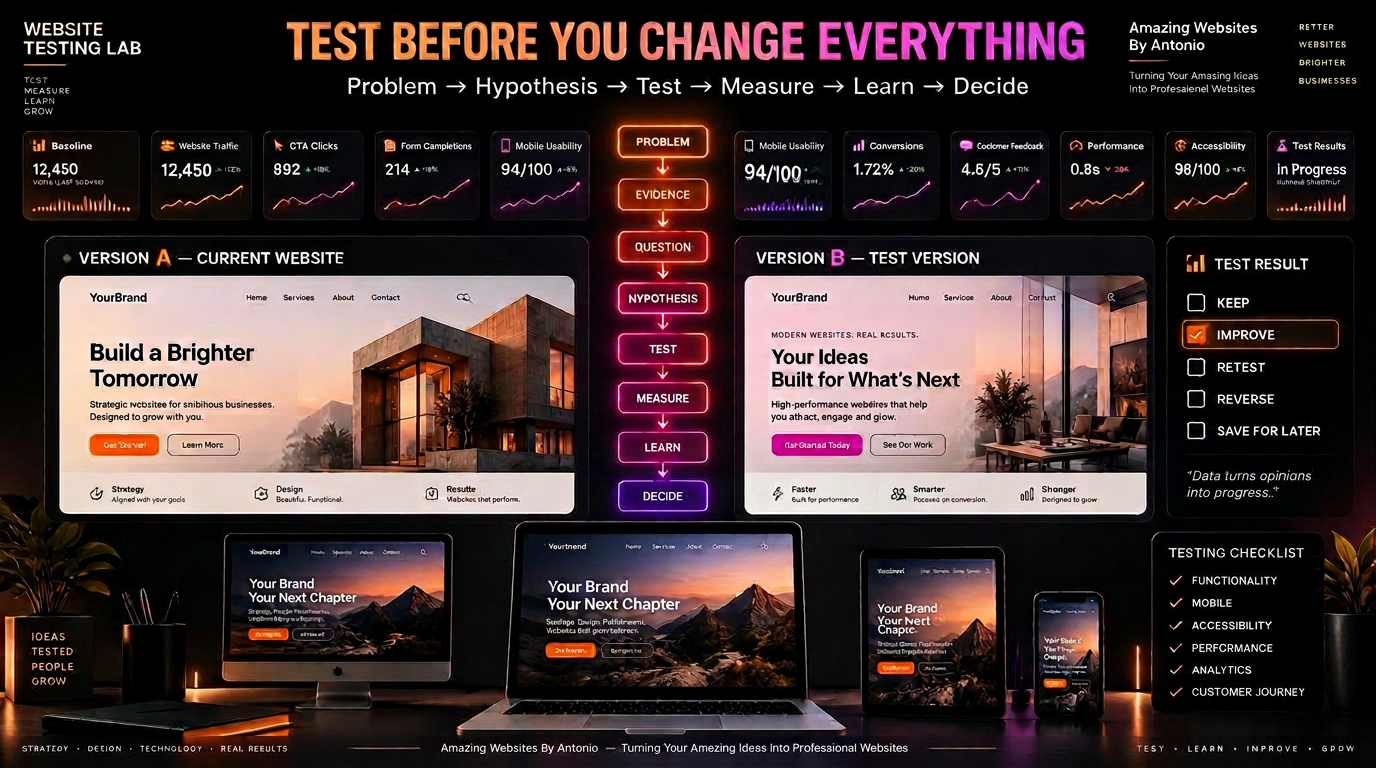
After an appropriate period, review the result. Ask: what changed? Did the intended action improve? Did anything unexpected happen? Should we keep the change, improve it further, reverse it, or test something else?
Measurement creates a learning loop.
36. Don't Force a Win
Sometimes an improvement won't produce the result you expected. That's useful information. A test doesn't have to succeed to teach you something.
Document what happened and keep learning.
37. Keep What Works
Not everything needs continuous optimization. If something works well and supports customers, don't change it simply because you feel like redesigning something.
Sometimes the correct action is: leave it alone.
38. Create a Monthly Analytics Meeting With Yourself or Team
Set aside dedicated time. Review your goals, key metrics, major changes, important patterns, customer feedback, problems, opportunities, and actions for next month.
Keep the discussion focused on decisions.
39. Limit Your Monthly Action Items
Don't leave the analytics review with 25 new projects. Choose perhaps your top three website actions, such as improving the mobile contact form, adding internal links to top-performing articles, and improving the visibility of an important service.
Focused action is easier to complete and evaluate.
40. Connect Analytics to Your Monthly Maintenance
Your website maintenance routine and analytics routine should work together. Maintenance finds broken links, outdated content, and technical issues. Analytics finds behavior patterns, content opportunities, customer-journey questions, and potential conversion issues.
Together they provide a more complete picture.
41. Connect Analytics to Your Improvement Roadmap
Your roadmap might contain Now, Next, Later, and Ideas. Analytics can help decide when something moves from Idea to Next, or from Next to Now.
Data helps strengthen prioritization.
42. Create a Simple Monthly Action Dashboard
For example, a monthly website action dashboard with a place for your primary goal, top metric, biggest positive change, biggest concern, top traffic source, top page, top content, top customer action, one important question, your top three actions, and the date of your next review.
Now your dashboard leads to decisions.
43. Don't Copy Someone Else's Action Plan
Another business may need more traffic; you may need better lead quality. Another business may need more sales; you may need more appointment bookings. Another business may need more blog readers; you may need more portfolio views.
Use your own goals.
44. Keep Privacy in the Process
Use analytics responsibly. Understand what information your tools collect, configure them appropriately, use applicable consent mechanisms, and maintain accurate privacy information. Follow relevant requirements for your business and jurisdiction, and seek appropriate professional guidance when necessary.
45. Remember the People Behind the Data
Analytics can make visitors look like numbers. But every number represents a person: someone looking for an answer, someone comparing services, someone deciding whether they trust the business, someone trying to contact you, someone considering a purchase.
Use analytics to improve their experience.
46. Build a Learning Loop
The goal isn't to finish analytics. It's to create a cycle: measure, observe, question, investigate, prioritize, improve, measure again, learn. Then repeat.
47. Move From Reporting to Decision-Making
A report says website traffic increased 20%. Decision-making asks: where did the additional traffic come from, what did those visitors do, and should we do more of what brought them here?
That's the difference.
48. Move From Data to Action
Don't end your analytics review with simply noting something was interesting. End it with what you're going to investigate, what you're going to improve, and what you're going to measure.
That's when analytics become useful.
49. Keep the Process Simple
You don't need a room full of giant screens, hundreds of charts, or measurements of everything. You need a goal, relevant data, good questions, thoughtful priorities, focused actions, and a process for learning.
50. Use Analytics to Make Your Website Smarter Over Time
The goal isn't simply more numbers. The goal is better decisions. Over time, analytics can help your website become clearer, easier to use, more relevant, more helpful, more focused, more connected to customer needs, and more aligned with business goals.
The Website Analytics Action Framework
- Step 1: Define the goal.
- Step 2: Review relevant data.
- Step 3: Identify patterns.
- Step 4: Ask questions.
- Step 5: Investigate.
- Step 6: Create action ideas.
- Step 7: Prioritize.
- Step 8: Make a focused improvement.
- Step 9: Measure the result.
- Step 10: Learn and repeat.
Final Thoughts
Website analytics shouldn't become a monthly collection of screenshots and numbers. They should help you make decisions.
Don't simply ask how many visitors you got. Ask where they came from, what they needed, what they did, where they struggled, what helped them move forward, and what you can improve. Then turn those answers into action.
Data, question, insight, priority, action, measurement, learning.
Your analytics dashboard isn't the finish line. It's the starting point for the next smart improvement. Because the most valuable website data isn't the data you collect — it's the data you learn from and use.
Amazing Websites By Antonio
Turning Your Amazing Ideas Into Professional Websites